­
26 10, 2015

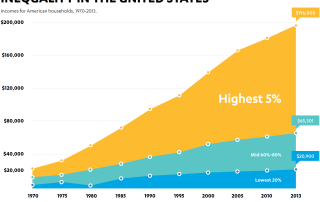
Infographics: “Inequality By The Numbers”

By |October 26th, 2015|Graphs We Like, Infographics|0 Comments

This infographic spread published in the Fall 2015 issue of UCLA BluePrint Magazine (by the UCLA Luskin School of Public Affairs), presents charts illustrating income inequality in California, in Los Angeles, and for the nation.

Read the full issue, “Rich and Poor: The Causes and Effects of Economic Inequality.”
 

30 09, 2015

What We’re Reading: IMF study says declines in union density & minimum wages linked to higher inequality

By |September 30th, 2015|What We're Reading|0 Comments

IMF finds that eroding unionization & slipping min wage => inequality. The IMF? What is world coming to? Its senses? http://t.co/Ic70EpZXcN

— Dr. Manuel Pastor (@Prof_MPastor) July 24, 2015