Infographics: “Inequality By The Numbers”
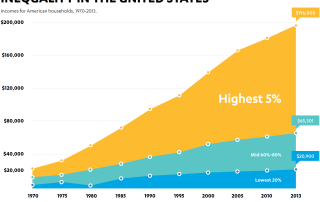
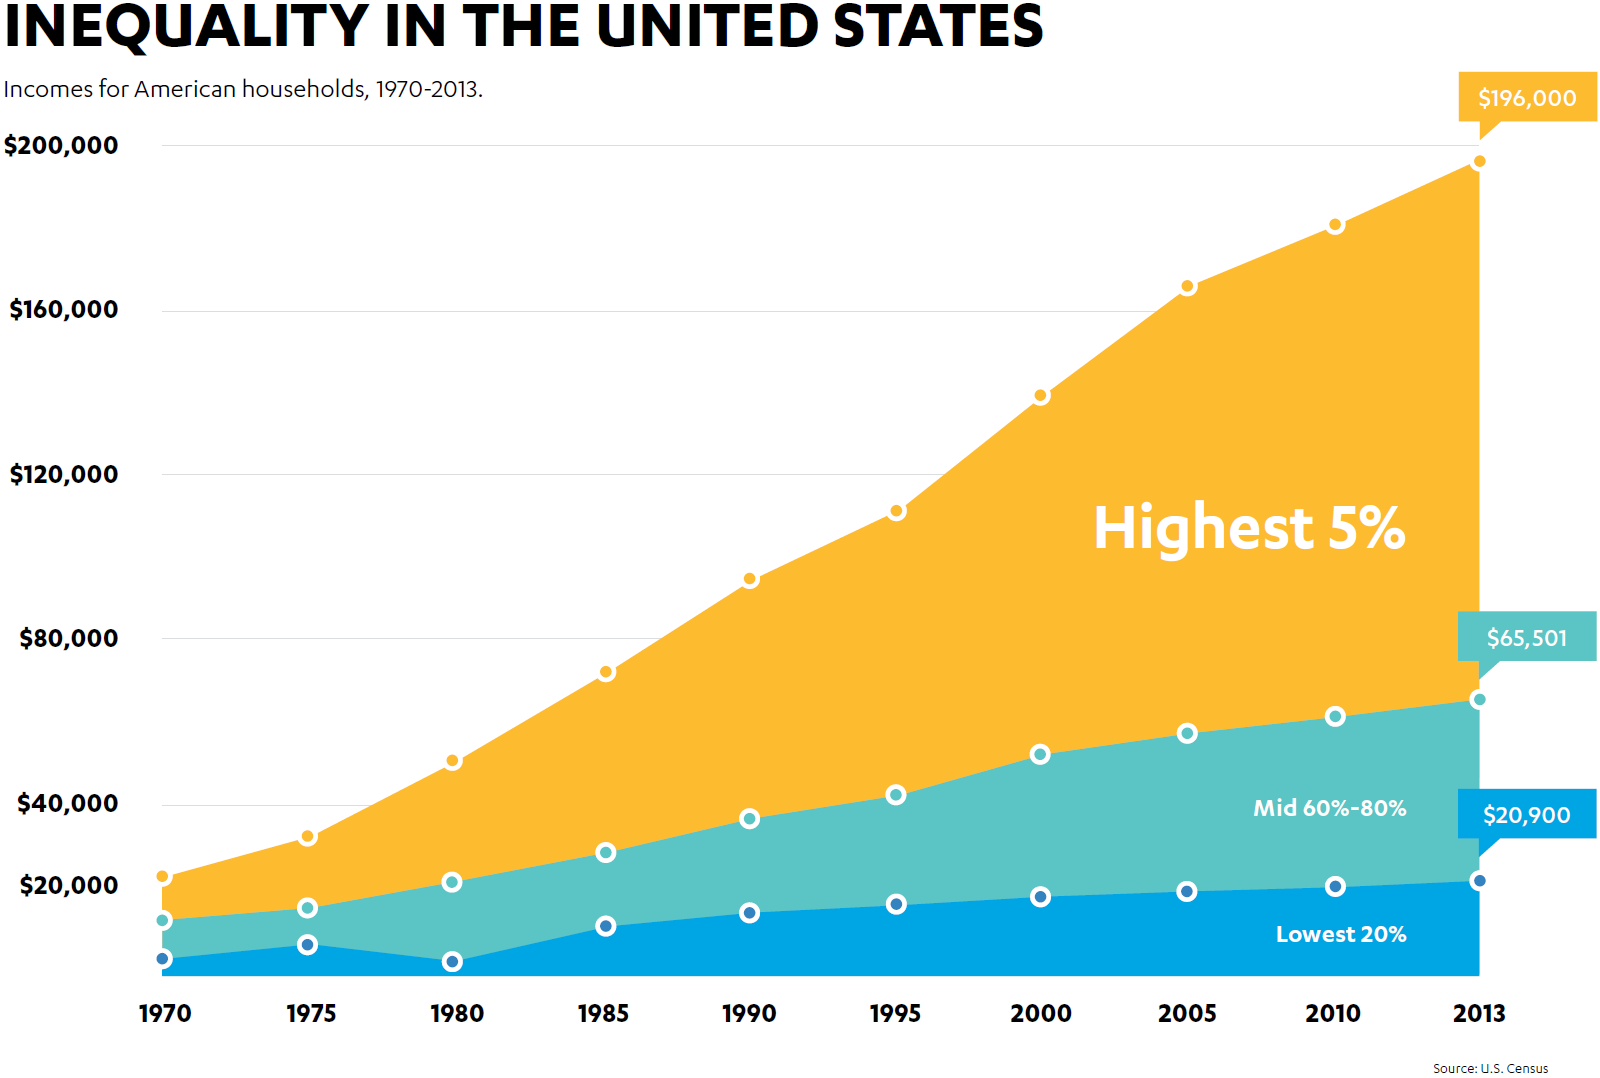
This infographic spread published in the Fall 2015 issue of UCLA BluePrint Magazine (by the UCLA Luskin School of Public Affairs), presents charts illustrating income inequality in California, in Los Angeles, and for the nation.
Read the full issue, “Rich and Poor: The Causes and Effects of Economic Inequality.”