
Metro Regions
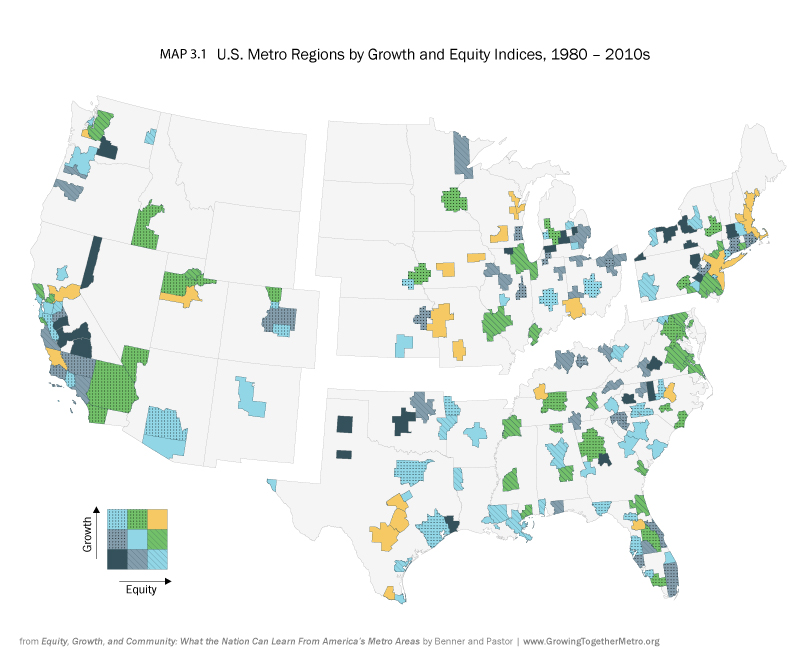
Equity, Growth, and Community presents case studies and emerging narratives on 11 metro regions on what’s happening with different types of multi-sector collaborations – places that are successfully working together, places working through conflict, and places somewhere in between. These approaches –whether planner-led, business-led, conflict-driven, or high tech/high road-centered – offer a range of strategies instructive for other metro regions grappling with similar issues. Learn more about the 11 case studies in our Metro Regions section.
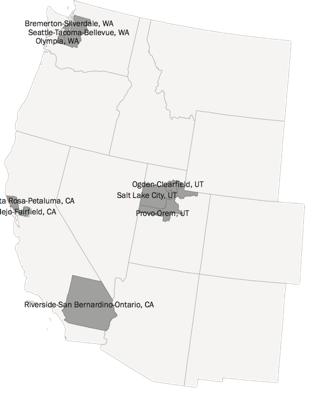
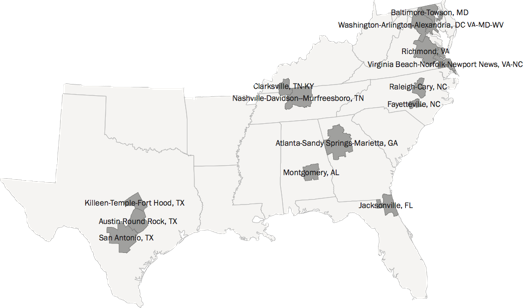
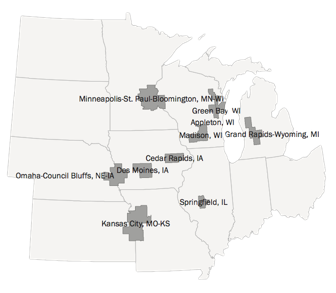
Maps and Charts
Check out featured images from the book, related research on equity and growth, and other featured data visuals on our Maps and Charts page.
Data
Access interactive tables and downloadable metro-level data and rankings on measures of equity and growth (including by US census-designated regions: Northeast, Midwest, South, or West) on our Data page.
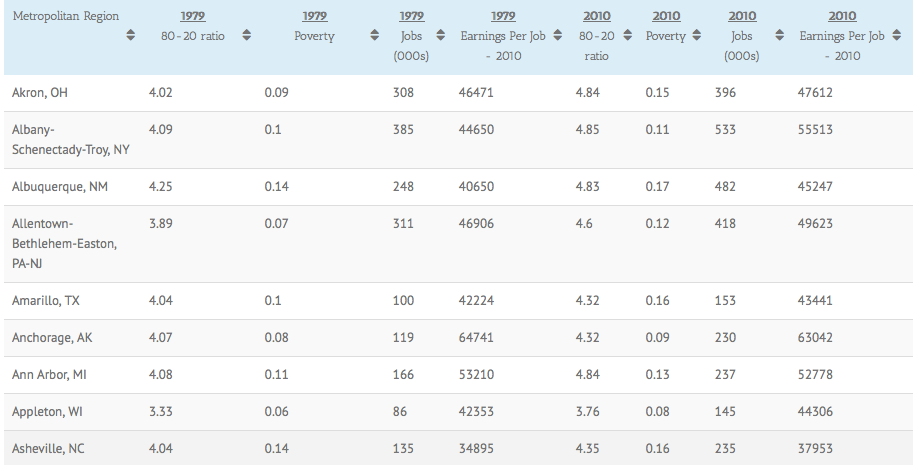
| Metropolitan Region | 1979 80-20 ratio | 1979 Poverty | 1979 Jobs (000s) | 1979 Earnings Per Job - 2010 | 2010 80-20 ratio | 2010 Poverty | 2010 Jobs (000s) | 2010 Earnings Per Job - 2010 | Equity Index Value | Equity Index Rank | Growth Index Value | Growth Index Rank | 2010 Gini | 2010 Median Income -2010 |
|---|---|---|---|---|---|---|---|---|---|---|---|---|---|---|
| Northeast average (unweighted) | 4.08 | 0.09 | 717 | 43849 | 4.74 | 0.12 | 942 | 52946 | 0 | 98 | 0 | 96 | 0.45 | 55816 |
| Albany-Schenectady-Troy, NY | 4.09 | 0.1 | 385 | 44650 | 4.85 | 0.11 | 533 | 55513 | 0.04 | 94 | 0.19 | 70 | 0.44 | 55796 |
| Allentown-Bethlehem-Easton, PA-NJ | 3.89 | 0.07 | 311 | 46906 | 4.6 | 0.12 | 418 | 49623 | -0.52 | 169 | -0.21 | 117 | 0.43 | 55630 |
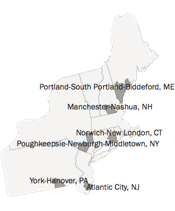
| Atlantic City, NJ | 4.53 | 0.13 | 100 | 44653 | 4.59 | 0.14 | 175 | 48114 | 0.67 | 17 | 0.27 | 60 | 0.43 | 52571 |
| Barnstable Town, MA | 4.06 | 0.09 | 74 | 31321 | 4.21 | 0.11 | 138 | 39738 | 0.52 | 27 | 1.12 | 8 | 0.47 | 55294 |
| Binghamton, NY | 4.03 | 0.09 | 131 | 43536 | 4.49 | 0.15 | 133 | 45859 | -0.28 | 141 | -1.17 | 188 | 0.43 | 45959 |
| Boston-Cambridge-Quincy, MA-NH | 4.4 | 0.09 | 2214 | 44185 | 5.08 | 0.1 | 3078 | 68235 | 0.31 | 47 | 0.83 | 22 | 0.47 | 68020 |
| Bridgeport-Stamford-Norwalk, CT | 4.4 | 0.07 | 443 | 50342 | 5.66 | 0.09 | 598 | 81934 | -0.51 | 167 | 0.87 | 19 | 0.54 | 74831 |
| Buffalo-Niagara Falls, NY | 4.47 | 0.1 | 598 | 46867 | 4.96 | 0.14 | 637 | 48829 | 0.19 | 64 | -0.9 | 182 | 0.45 | 46420 |
| Erie, PA | 3.93 | 0.1 | 138 | 43909 | 5.21 | 0.17 | 156 | 41779 | -1.05 | 188 | -0.99 | 184 | 0.45 | 42519 |
| Harrisburg-Carlisle, PA | 3.65 | 0.08 | 258 | 44852 | 4.04 | 0.11 | 384 | 52275 | 0.17 | 70 | 0.2 | 67 | 0.42 | 54009 |
| Hartford-West Hartford-East Hartford, CT | 3.74 | 0.08 | 615 | 47062 | 4.65 | 0.1 | 774 | 63313 | -0.37 | 157 | 0.16 | 73 | 0.45 | 63104 |
| Lancaster, PA | 3.54 | 0.08 | 193 | 41755 | 4.11 | 0.1 | 294 | 44502 | 0.09 | 84 | 0.01 | 87 | 0.42 | 51740 |
| Manchester-Nashua, NH | 3.73 | 0.07 | 155 | 39710 | 3.9 | 0.07 | 248 | 56658 | 0.82 | 7 | 0.88 | 18 | 0.41 | 68312 |
| New Haven-Milford, CT | 4.09 | 0.09 | 385 | 43233 | 5.09 | 0.12 | 476 | 54745 | -0.32 | 151 | -0.12 | 105 | 0.47 | 57056 |
| New York-Northern New Jersey-Long Island, NY-NJ-PA | 5.16 | 0.13 | 8178 | 52246 | 5.64 | 0.14 | 10837 | 72992 | 0.59 | 24 | 0.45 | 42 | 0.5 | 61927 |
| Norwich-New London, CT | 3.71 | 0.08 | 123 | 45221 | 4.19 | 0.09 | 168 | 55087 | 0.37 | 42 | 0.14 | 76 | 0.43 | 62349 |
| Philadelphia-Camden-Wilmington, PA-NJ-DE-MD | 4.48 | 0.12 | 2532 | 48507 | 5.14 | 0.13 | 3391 | 62206 | 0.34 | 45 | 0.21 | 64 | 0.47 | 58095 |
| Pittsburgh, PA | 4.33 | 0.09 | 1231 | 50865 | 4.82 | 0.12 | 1392 | 53715 | 0.3 | 50 | -0.64 | 173 | 0.47 | 46700 |
| Portland-South Portland-Biddeford, ME | 3.53 | 0.1 | 200 | 38154 | 4.2 | 0.1 | 338 | 46381 | 0.29 | 54 | 0.74 | 26 | 0.43 | 56530 |
| Poughkeepsie-Newburgh-Middletown, NY | 3.97 | 0.09 | 222 | 43434 | 4.18 | 0.09 | 327 | 49388 | 0.6 | 23 | 0.16 | 74 | 0.42 | 67269 |
| Providence-New Bedford-Fall River, RI-MA | 4.47 | 0.1 | 700 | 38115 | 5.43 | 0.14 | 846 | 50689 | -0.28 | 140 | 0.02 | 86 | 0.46 | 51935 |
| Reading, PA | 3.92 | 0.08 | 164 | 43395 | 4.51 | 0.14 | 218 | 46277 | -0.6 | 172 | -0.31 | 131 | 0.44 | 51759 |
| Rochester, NY | 4.06 | 0.09 | 493 | 48357 | 4.68 | 0.14 | 611 | 50234 | -0.32 | 149 | -0.61 | 168 | 0.45 | 50211 |
| Scranton--Wilkes-Barre, PA | 3.74 | 0.1 | 266 | 39358 | 4.73 | 0.15 | 311 | 42509 | -0.47 | 162 | -0.62 | 170 | 0.45 | 42368 |
| Springfield, MA | 4.48 | 0.12 | 306 | 38767 | 5.49 | 0.16 | 364 | 45551 | -0.27 | 139 | -0.38 | 136 | 0.45 | 49209 |
| Syracuse, NY | 4.11 | 0.1 | 311 | 44861 | 4.99 | 0.14 | 372 | 49880 | -0.3 | 148 | -0.56 | 158 | 0.46 | 49694 |
| Trenton-Ewing, NJ | 4.28 | 0.09 | 180 | 47963 | 5.19 | 0.12 | 260 | 69727 | -0.32 | 150 | 1.01 | 12 | 0.47 | 70956 |
| Utica-Rome, NY | 3.82 | 0.11 | 143 | 39734 | 4.61 | 0.15 | 159 | 44151 | -0.08 | 113 | -0.69 | 177 | 0.42 | 46625 |
| Worcester, MA | 4.23 | 0.09 | 311 | 39526 | 4.98 | 0.11 | 412 | 51648 | 0.09 | 83 | 0.17 | 72 | 0.44 | 61212 |
| York-Hanover, PA | 3.67 | 0.07 | 161 | 43981 | 3.88 | 0.09 | 217 | 46839 | 0.31 | 49 | -0.2 | 116 | 0.4 | 56368 |
Bibliography
Explore the full list of sources for Equity, Growth, and Community on our Bibliography page.