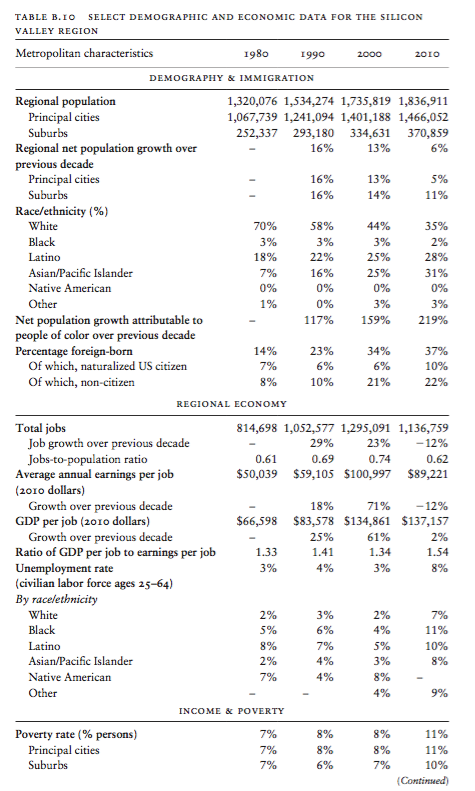
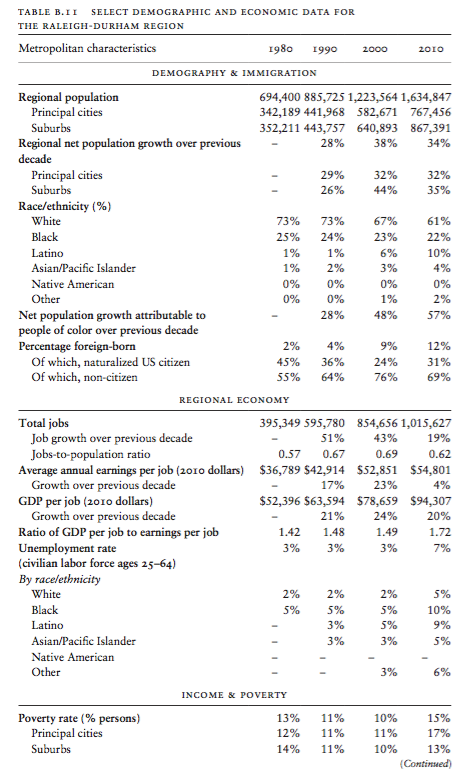
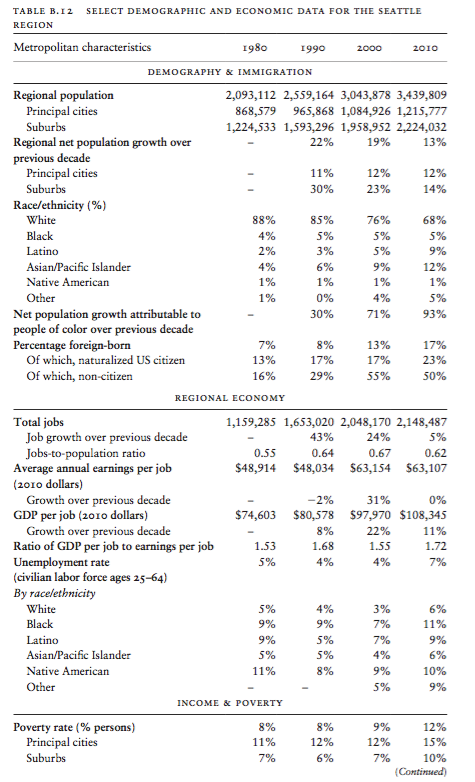
Metro Region Case Study Data
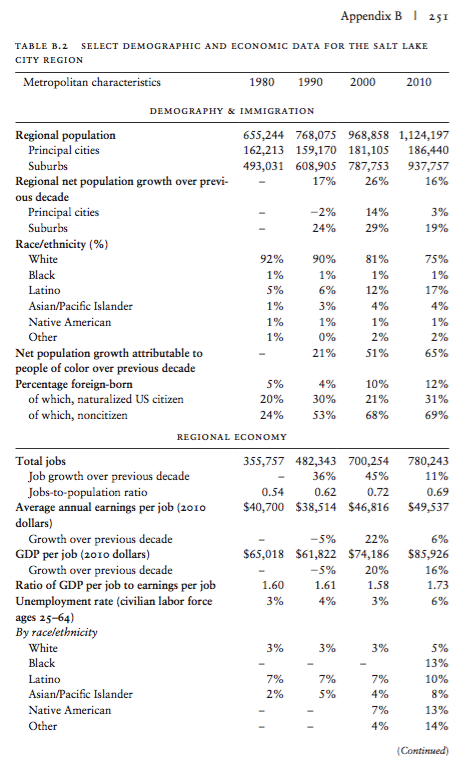
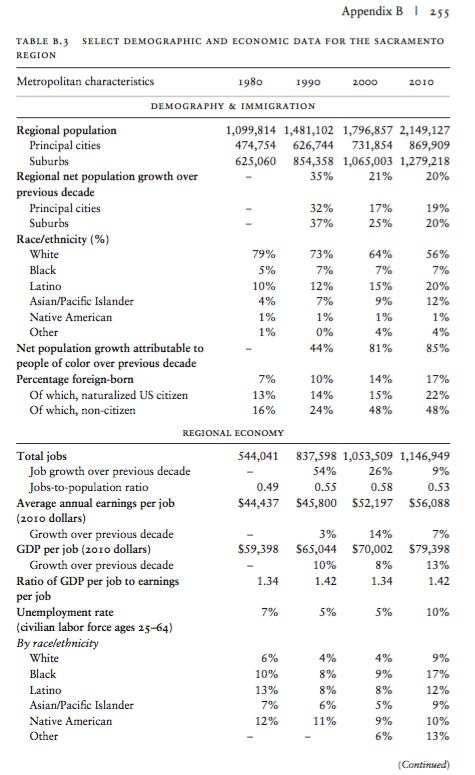
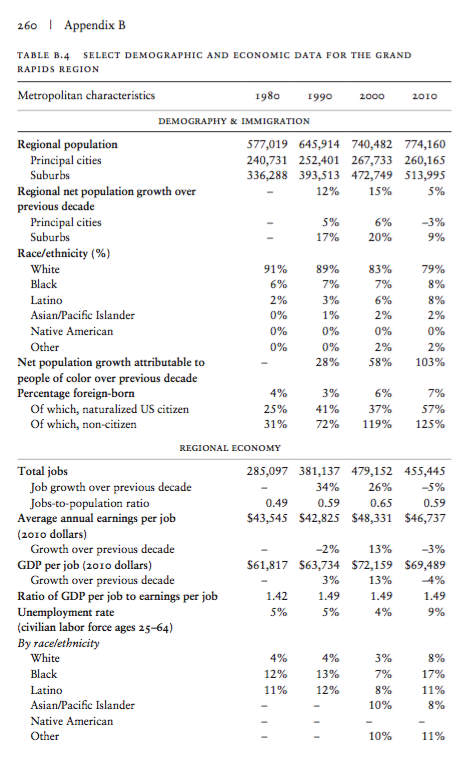
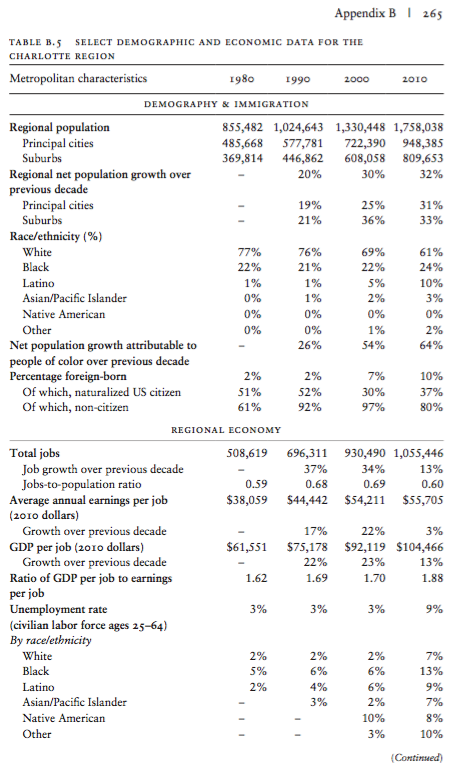
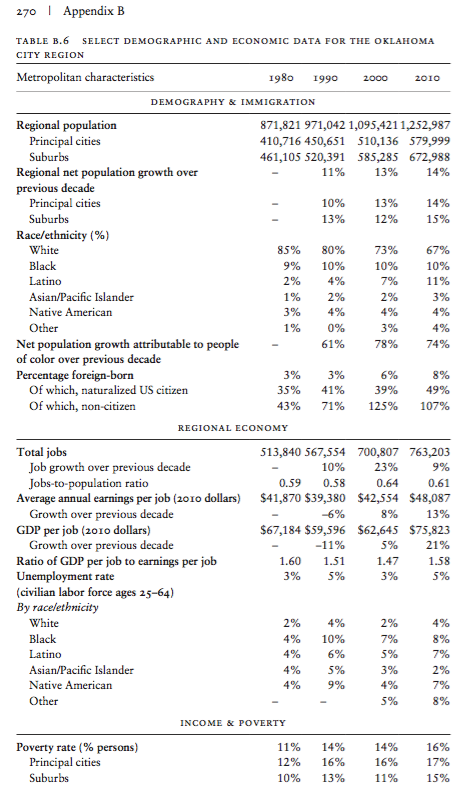
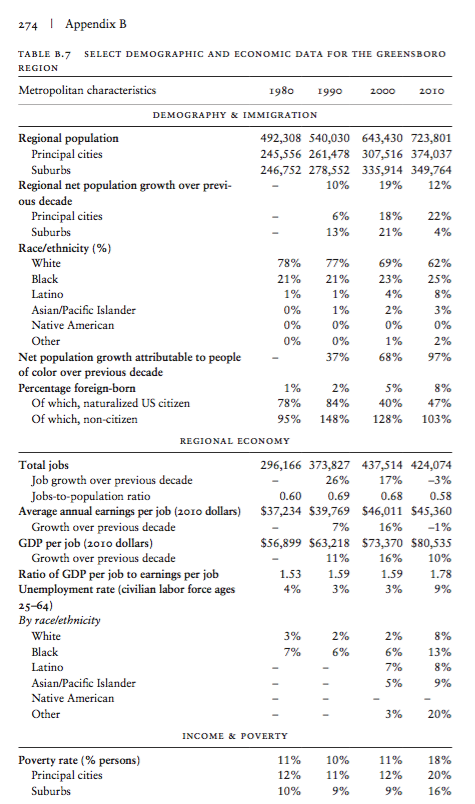
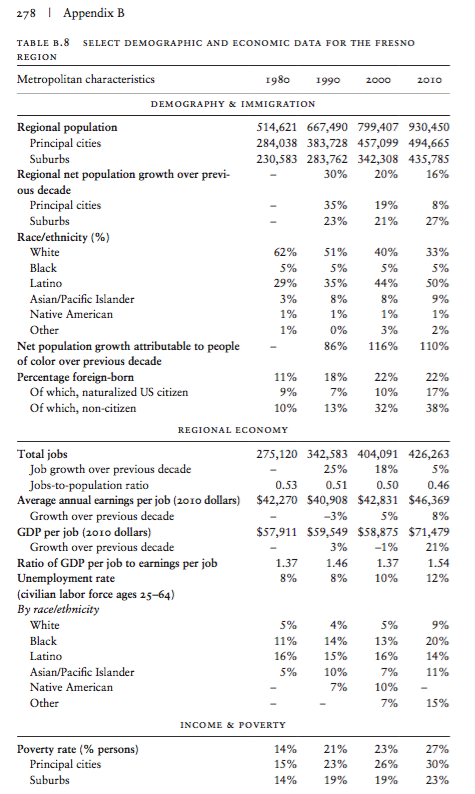
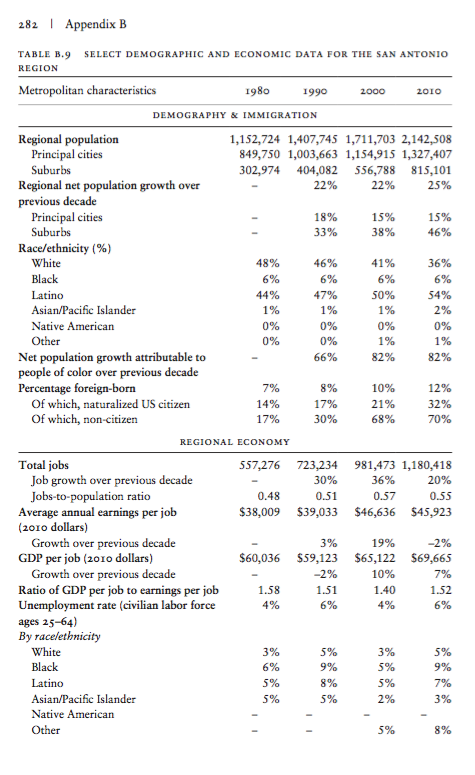
This series of tables offers a portrait of the demographic and economic characteristics of each region that served as a case study for this book. A wide variety of data sources were drawn from to create the tables, which are explained in Appendix B of the book.
Each region is defined by its corresponding metropolitan area as defined by the Office of Management and Budget’s (OMB’s) December 2003 Core Based Statistical Area (CBSA) definitions, except for the Raleigh-Durham region, which encompasses both the Raleigh and Durham metropolitan areas (two separate CBSAs). One key aspect of the data presented here is that it is geographically consistent over time. Given that metropolitan boundaries can shift from one decade to the next (and even in between), data collected for the same metropolitan area in various censuses does not necessarily represent the same geographic coverage. To make the data consistent, much of it (particularly for years prior to 2003) had to be collected at more detailed levels of geography and summarized according to the December 2003 CBSA boundaries.